


Advanced Spectro Analyzers: A Technical Exposition on Precision Color Measurement
The quantification and control of color represent a critical frontier in the manufacturing and quality assurance of modern industrial goods. In sectors ranging from consumer electronics to aerospace components, color consistency is not merely an aesthetic concern but a fundamental indicator of material integrity, process stability, and brand compliance. Advanced Spectro Analyzers have emerged as the preeminent technology for this task, offering unparalleled precision and objectivity over traditional visual or filter-based methods. These instruments function by measuring the spectral reflectance or transmittance of a material, providing a complete and quantifiable color fingerprint. This article provides a detailed technical examination of the principles, capabilities, and applications of these analyzers, with a specific focus on their role in ensuring material compliance and quality in the electrical and electronic industries.
Fundamental Principles of Spectrophotometric Analysis
At its core, a spectrophotometer for color measurement operates on the principle of illuminating a sample with a controlled light source and precisely quantifying the intensity of light reflected or transmitted at each wavelength across the visible spectrum, typically from 380 nm to 780 nm. The instrument’s optical system comprises several key components: a stable light source, often a pulsed xenon lamp for its consistent spectral output; a monochromator or diffraction grating to disperse the light into its constituent wavelengths; and a high-sensitivity photodetector array to capture the resulting spectral data. The raw spectral reflectance curve is the primary datum, representing the fraction of incident light reflected by the sample at each wavelength. This curve is then computationally transformed into standardized colorimetric values, such as CIE Lab and LCh, through the integration of the reflectance data with standard observer functions and a defined illuminant, such as D65 (daylight). The Lab color space is particularly valuable in industrial settings as it is perceptually uniform, meaning the calculated color difference (ΔE) values correlate closely with human visual perception, enabling the establishment of numerically precise tolerance limits for production batches.
The Critical Nexus of Color Measurement and Material Compliance
In the context of electrical and electronic equipment, precision color measurement transcends appearance and directly intersects with material compliance and safety. The color of a plastic polymer, for instance, can be an indicator of its composition and the presence of certain additives. A deviation from a specified shade of black in a cable insulation might suggest inconsistent mixing of carbon black, a common flame retardant, or the unintended inclusion of recycled material containing restricted substances. Consequently, spectro analyzers are deployed not only in color labs but also in material inspection stations to screen for anomalies that could signal non-compliance with stringent international regulations. The ability to detect subtle color shifts provides an indirect, non-destructive method for monitoring the consistency of raw materials and finished components, serving as an early warning system for potential failures in the supply chain or manufacturing process that could lead to more serious compliance breaches.
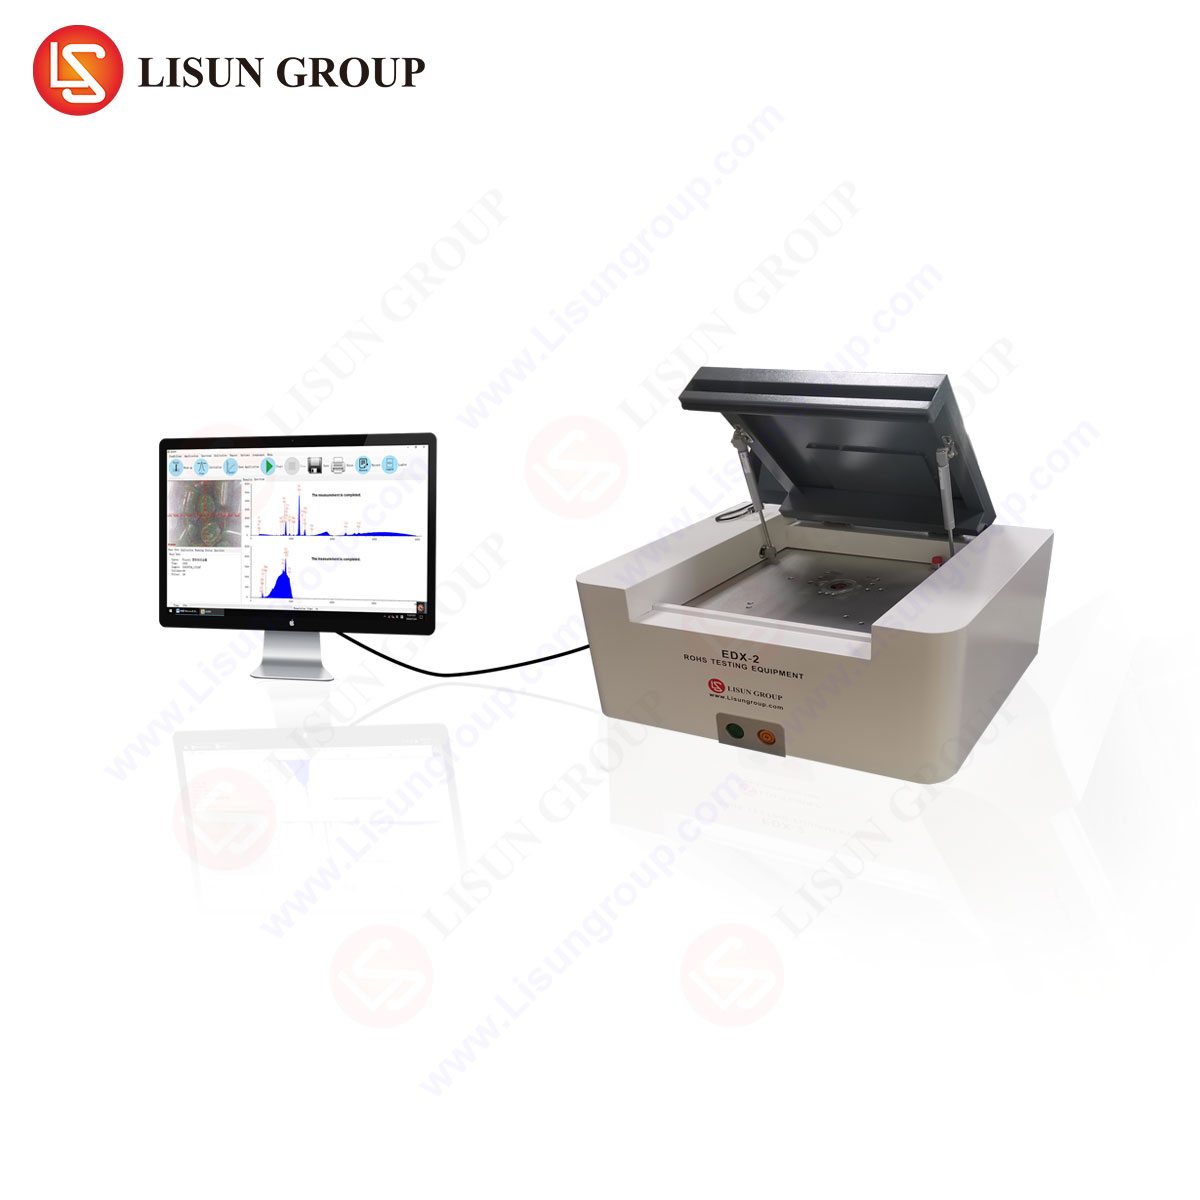
EDX-2A RoHS Test System: Integration of Elemental and Colorimetric Analysis
A sophisticated extension of this principle is embodied in the LISUN EDX-2A RoHS Test System. While its primary function is the quantitative analysis of restricted hazardous substances (Pb, Cd, Hg, Cr(VI), Br, Cl) via Energy Dispersive X-ray Fluorescence (ED-XRF) spectroscopy, its operational paradigm underscores the interconnectedness of material composition and physical properties, including color. The system is engineered to provide rapid, non-destructive screening of a vast array of components, from the minute solder joints on a printed circuit board to the plastic housings of household appliances. The precision required for elemental analysis—detecting cadmium at levels below 100 ppm, for example—demands an instrument of exceptional stability and analytical rigor, attributes that are equally critical for high-fidelity color measurement in adjacent quality control processes.
The EDX-2A utilizes a high-performance X-ray tube and a state-of-the-art semiconductor detector, such as a Silicon Drift Detector (SDD), to achieve low detection limits and high resolution. It features comprehensive and user-configurable testing modes for different material matrices (paints, polymers, metals), and its software automatically generates compliance reports aligned with directives like EU RoHS 3 (2011/65/EU) and China RoHS. The system’s ability to handle diverse sample sizes and geometries makes it indispensable for the heterogeneous nature of electronic assemblies.
Key Technical Specifications of the EDX-2A System:
- Analysis Element Range: Sodium (Na) to Uranium (U).
- Detector: High-resolution Silicon Drift Detector (SDD), cooled by a Peltier device.
- X-Ray Tube: High-performance, air-cooled end-window tube with adjustable voltage (up to 50 kV).
- Measurement Chamber: Large, accessible sample chamber with a motorized adjustable stage and integrated HD camera for precise sample positioning.
- Analysis Time: Typically 30-300 seconds, user-definable.
- Minimum Detection Limits (MDL): For Cadmium (Cd) < 1 ppm; for Lead (Pb) < 2 ppm.
- Software: Full-featured, with qualitative, quantitative, and screening analysis, and dedicated RoHS/ELV compliance reporting modules.
Industry-Specific Applications in Electrical and Electronic Sectors
The application of advanced analytical systems like spectro analyzers and the EDX-2A is pervasive across the lifecycle of electronic products. In the domain of Consumer Electronics and Office Equipment, the color consistency of device casings, keycaps, and bezels is paramount for brand identity. A spectro analyzer ensures that all components, often sourced from multiple suppliers across different continents, match perfectly. Simultaneously, the EDX-2A is used to screen these plastic and metal parts for RoHS compliance, verifying the absence of lead-based pigments or cadmium-stabilized polymers.
Within Automotive Electronics and Aerospace and Aviation Components, the operational environment is harsh, involving extreme temperatures and vibrations. The color of wire insulation is frequently coded for circuit identification. A spectro analyzer ensures this coding is durable and consistent, while the EDX-2A confirms that the insulation materials do not contain hexavalent chromium, a carcinogen restricted by both RoHS and the End-of-Life Vehicles (ELV) Directive. For Lighting Fixtures, particularly LEDs, color temperature (CCT) and Color Rendering Index (CRI) are critical performance metrics measured precisely by spectrophotometers. The solder and substrates within the LED assemblies are screened with the EDX-2A to prevent the use of lead-containing solders.
Telecommunications Equipment and Industrial Control Systems rely on complex, high-density PCBs. The EDX-2A performs fast, non-destructive screening of these boards for restricted substances, while spectrophotometers are used to verify the color of conformal coatings and connector housings. In Medical Devices, color can be a critical user interface element (e.g., button color for different functions), and its accuracy is assured through spectral measurement. Regulatory scrutiny on material composition in this sector is intense, making RoHS screening with systems like the EDX-2A a mandatory part of the quality assurance protocol.
Methodological Framework for Precision Measurement and Calibration
Achieving laboratory-grade precision in a production environment necessitates a rigorous methodological framework. For spectrophotometric color measurement, this begins with a meticulous calibration routine. The instrument must be calibrated to two primary standards: zero reflectance (using a light trap or closed port) and 100% reflectance (using a certified white calibration tile). Regular calibration ensures the instrument’s baseline remains stable over time. Sample presentation is equally critical; measurements must be taken on a uniform, clean, and opaque area. For translucent materials, a sufficient number of layers must be stacked to achieve opacity, or a backing material of known reflectance must be used consistently. The instrument’s measurement geometry (e.g., d/8° sphere or 45°/0°) must be selected appropriately for the sample’s surface characteristics (glossy, matte, textured).
For elemental analysis with the EDX-2A, the methodology is centered on robust calibration curves. The system is calibrated using a set of certified reference materials (CRMs) that span the expected concentration ranges and material types. The precision of the measurement is heavily dependent on consistent sample positioning and preparation. The sample must be perfectly flush with the measurement aperture to ensure a consistent X-ray path length. The analysis of irregular or small components often requires the use of a sample cup or a specialized fixture to maintain this geometric consistency. The software’s ability to account for different material matrices (e.g., distinguishing between a brominated flame retardant in plastic and a surface coating containing bromine) is a key factor in avoiding false positives or negatives.
Quantifying Uncertainty and Establishing Pass/Fail Criteria
In any quantitative measurement system, understanding and controlling measurement uncertainty is paramount. For color measurement, uncertainty arises from factors such as instrument repeatability, reproducibility between different instruments (inter-instrument agreement), sample non-uniformity, and operator technique. A comprehensive quality control program will quantify this uncertainty through Gage Repeatability and Reproducibility (Gage R&R) studies. The established color tolerance, typically defined as a maximum ΔE value (e.g., ΔE < 1.0 for a critical color match), must be significantly larger than the total measurement uncertainty to be actionable.
For the EDX-2A, measurement uncertainty is a function of counting statistics, sample homogeneity, and the accuracy of the underlying calibration model. The system provides statistical data for each measurement, including peak intensities and calculated concentrations with associated error margins. A fundamental aspect of RoHS screening is the establishment of clear pass/fail thresholds. Due to measurement uncertainty, a “gray zone” is typically defined. For example, if the regulatory limit for cadmium is 100 ppm, the screening protocol may be configured as follows:
| Concentration Result | Action |
|---|---|
| < 75 ppm | Pass – Result is sufficiently below the limit, accounting for uncertainty. |
| 75 – 125 ppm | Gray Zone – Inconclusive; requires verification with a reference method (e.g., ICP-MS). |
| > 125 ppm | Fail – Result is sufficiently above the limit, accounting for uncertainty. |
This conservative approach prevents non-compliant materials from proceeding in the supply chain while minimizing the unnecessary rejection of compliant materials.
Synergistic Data Integration for Comprehensive Quality Assurance
The most advanced manufacturing operations do not treat color measurement and material compliance as isolated functions. Instead, they leverage data integration to create a holistic view of product quality. The numerical color data (L, a, b) from a spectro analyzer and the elemental composition data from an EDX-2A can be fed into a centralized Statistical Process Control (SPC) system. Correlations can then be investigated; for instance, a consistent drift in the b value (yellowness) of a white polymer component could be cross-referenced with the EDX-2A data to see if it coincides with a trace increase in a specific element, potentially identifying a contaminated batch of raw material. This synergistic analysis transforms raw data into actionable intelligence, enabling predictive quality control and continuous process improvement.
Frequently Asked Questions (FAQ)
Q1: How does the EDX-2A differentiate between bromine present in a restricted flame retardant (PBB, PBDE) and bromine that may be part of a compliant polymer matrix?
The EDX-2A, as a screening tool, measures total bromine content. It cannot spectroscopically distinguish between different brominated compounds. If the total bromine concentration exceeds a pre-set threshold (e.g., 500-1000 ppm, depending on the material and risk assessment), it flags the sample for further investigation. Confirmatory analysis using a technique like Gas Chromatography-Mass Spectrometry (GC-MS) is then required to identify and quantify the specific brominated flame retardants present.
Q2: What is the significance of the measurement geometry (d/8° vs. 45°/0°) in color spectrophotometry, and which is more appropriate for glossy electronic components?
The geometry defines how light is projected onto the sample and how the reflected light is collected. A d/8° (diffuse illumination, 8° viewing) sphere instrument can measure with specular component included (SCI) or excluded (SCE). SCI is generally preferred for glossy electronic components as it measures the intrinsic color of the material, ignoring surface gloss, which provides better correlation with formulation and is more repeatable. A 45°/0° geometry inherently excludes the specular reflection and is better for correlating with visual assessments under standard lighting, but it can be more sensitive to surface texture and orientation.
Q3: For small, irregularly shaped components like surface-mount device (SMD) resistors, how can accurate color and RoHS measurements be achieved?
For color measurement, a spectrophotometer with a very small measurement aperture (e.g., 3mm or less) is required to target the uniform, colored area of the resistor. For RoHS screening with the EDX-2A, the motorized stage and HD camera are crucial. The component is precisely positioned under the camera to ensure the X-ray beam is directed solely at the body of the resistor, avoiding the metal terminals which would give a different elemental signature. Specialized fixtures may be used to hold multiple small components for batch screening.
Q4: Can the EDX-2A reliably detect hexavalent chromium (Cr(VI)), given that it measures total chromium?
No, XRF is a elemental analysis technique and cannot determine chemical speciation. The EDX-2A accurately measures total chromium content. If the total chromium exceeds a screening threshold (typically several hundred ppm for a coating or polymer), it indicates a potential risk for the presence of Cr(VI). A positive screening result must be followed by a wet chemical speciation method, such as colorimetric diphenylcarbazide testing or ion chromatography, as prescribed by standards like IEC 62321-7-2, to confirm or deny the presence of the restricted Cr(VI) species.