


Energy-Dispersive X-ray Spectroscopy: Fundamental Principles and Analytical Applications
Energy-Dispersive X-ray Spectroscopy (EDX or EDS) represents a cornerstone analytical technique within the domain of materials characterization. Integrated commonly with electron microscopy platforms, such as Scanning Electron Microscopes (SEM), it provides rapid, non-destructive qualitative and quantitative elemental analysis of a sample’s near-surface region. Its utility spans from fundamental research to critical industrial quality control, particularly in sectors governed by stringent material composition regulations. This article delineates the core physical principles underpinning EDX spectroscopy, explores its operational modalities, and examines its pivotal role in ensuring compliance and reliability within modern manufacturing ecosystems, with specific reference to advanced commercial systems.
The Physical Foundation: X-ray Generation and Detection
The analytical capability of EDX spectroscopy is predicated upon the interaction of a focused, high-energy electron beam with the atoms constituting a specimen. When incident electrons, typically accelerated through potentials of 5-30 kV, penetrate the sample, they undergo both elastic and inelastic scattering events. For EDX analysis, the critical inelastic interactions are those that result in the ejection of inner-shell electrons from constituent atoms.
This ejection creates an ionized atom with a core-shell vacancy, an inherently unstable state. The atom undergoes almost instantaneous de-excitation to restore equilibrium. This process can occur via two primary pathways: the emission of a characteristic X-ray photon or the ejection of an Auger electron. The probability of X-ray emission, termed the fluorescence yield, increases with atomic number (Z). In EDX, the characteristic X-rays are the analytical signal of interest.
Each element possesses a unique atomic structure, defined by discrete energy levels for its electron shells (K, L, M, etc.). Consequently, the energy of the emitted X-ray photon, corresponding to the difference in energy between the initial vacancy shell and the shell from which an electron fills it, is uniquely characteristic of the parent element. For example, the transition of an electron from the L₃ shell to fill a K-shell vacancy produces a Kα₁ X-ray, with an energy specific to the element. A spectral plot of X-ray intensity versus energy thus yields a fingerprint of the sample’s elemental composition.
Detection of these X-rays is accomplished via a solid-state semiconductor detector, most commonly composed of lithium-drifted silicon [Si(Li)] or high-purity germanium. Modern systems increasingly utilize silicon drift detectors (SDD) due to their superior count-rate capability and energy resolution at high throughputs. An incident X-ray photon generates electron-hole pairs within the detector crystal; the number of pairs is proportional to the X-ray’s energy. This charge pulse is converted to a voltage pulse by a preamplifier and subsequently processed by a multichannel analyzer to sort and count the pulses by energy, constructing the characteristic EDX spectrum.
Operational Modalities: Qualitative, Quantitative, and Mapping Analyses
EDX systems support several distinct analytical modalities, each serving specific investigative purposes. Qualitative analysis involves the identification of all elements present above the detection limit (typically ~0.1 weight percent for most elements under optimal conditions) by matching spectral peaks to known energy libraries. This is the most straightforward application, used for rapid material identification or contamination screening.
Quantitative analysis transforms spectral data into weight or atomic percentage compositions. This process is non-trivial, requiring correction for matrix effects—phenomena that alter the generation, emission, and detection of characteristic X-rays relative to a pure standard. These effects include:
- Atomic Number (Z) Effect: Differences in electron scattering and penetration depth.
- Absorption (A) Effect: Absorption of generated X-rays within the sample itself before they escape.
- Fluorescence (F) Effect: Secondary excitation of elements by X-rays from other elements.
Sophisticated software algorithms, such as the ZAF or φ(ρz) correction routines, are applied to raw intensity data to yield accurate quantitative results, often with an accuracy of ±2-5% relative for major constituents.
Beyond point analysis, elemental mapping provides a spatial distribution of elements across a defined area. By synchronizing the electron beam raster with spectral acquisition, a map of X-ray intensity for a selected energy range (corresponding to a specific element) is generated for each pixel. This visualizes phases, inclusions, diffusion gradients, and contamination sites. Line scans offer a one-dimensional concentration profile along a user-defined transect, useful for examining interfaces or coatings.
Critical Role in Regulatory Compliance and Failure Analysis
The proliferation of global environmental and safety regulations has cemented EDX as an indispensable tool in industrial laboratories. Foremost among these is the Restriction of Hazardous Substances (RoHS) directive, which limits the concentration of ten substances—lead (Pb), mercury (Hg), cadmium (Cd), hexavalent chromium (Cr(VI)), and specific brominated flame retardants (PBB, PBDE)—in Electrical and Electronic Equipment (EEE). Similar regulations include the EU’s REACH and various national hazardous substance controls.
EDX spectroscopy is the primary screening technique for RoHS compliance due to its ability to rapidly detect and quantify regulated elements. A compliant system must reliably measure concentrations at or below the maximum permitted values (e.g., 1000 ppm for Pb, Hg, Cr, Br; 100 ppm for Cd). This demands not only high detector sensitivity but also robust quantification software and calibration methodologies. The technique is applied across the entire supply chain, from verifying the composition of raw materials—such as plastics, alloys, and solders—to auditing finished products.
In failure analysis and quality assurance, EDX is instrumental in diagnosing root causes. In Automotive Electronics, it can identify tin whisker growth on lead-free solder joints or corrosive sulfur residues on connectors. For Aerospace and Aviation Components, it verifies coating compositions and detects foreign object debris. Within Medical Device manufacturing, it ensures the absence of toxic elements in biocompatible alloys and polymers. In Lighting Fixtures and Consumer Electronics, it screens for prohibited substances in plastics, circuit boards, and wiring insulation. Telecommunications Equipment and Industrial Control Systems rely on EDX to analyze solder joint integrity and identify conductive anodic filament (CAF) growth, which often involves the detection of chlorine and copper.
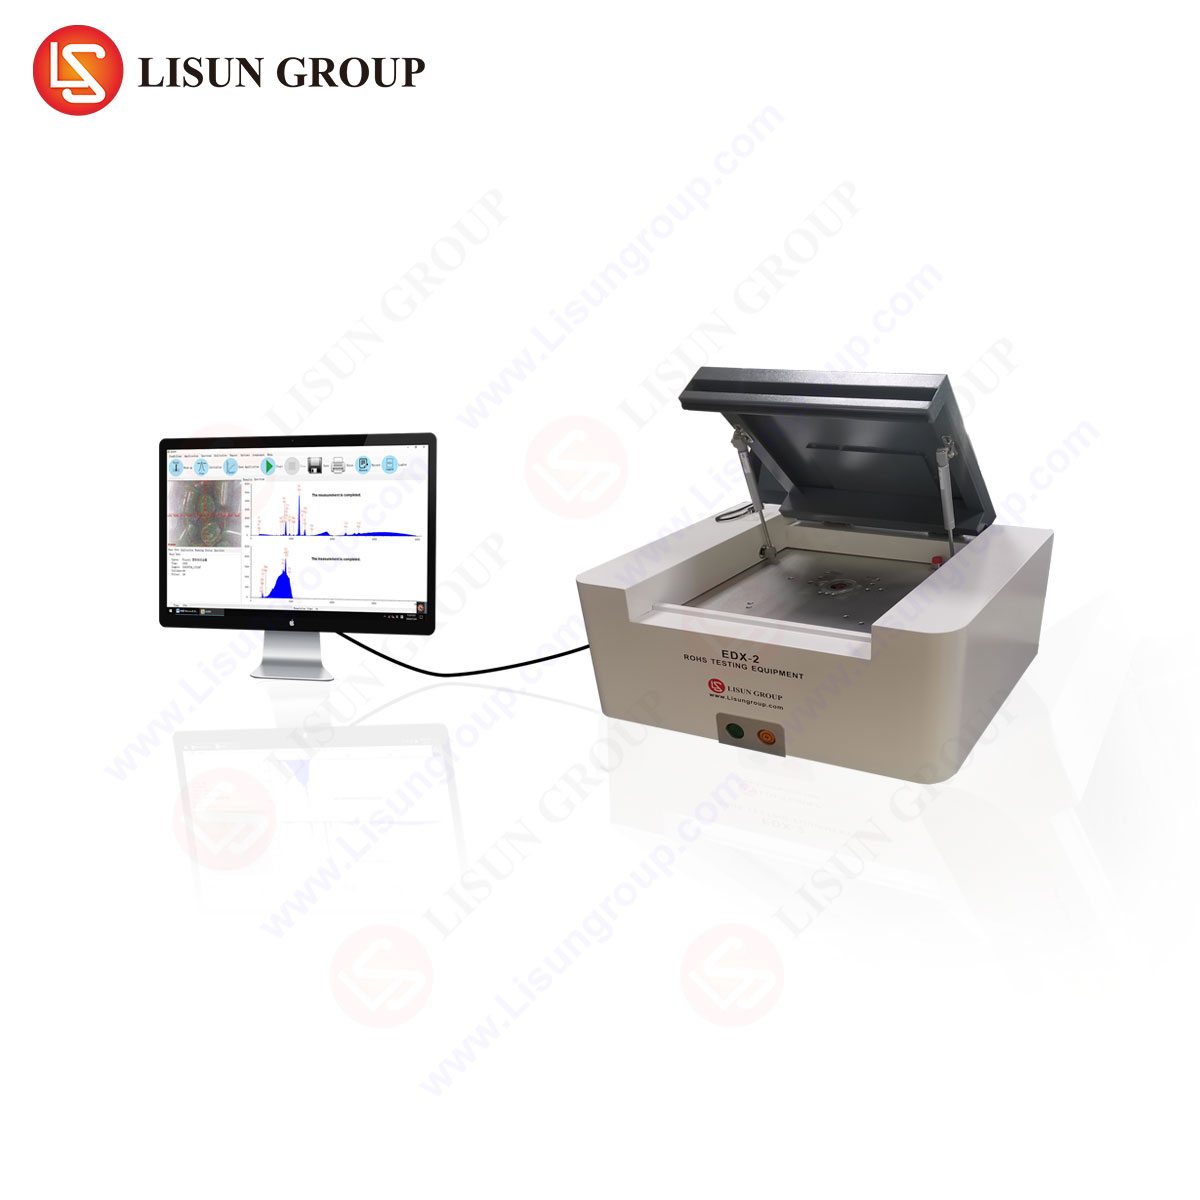
The LISUN EDX-2A RoHS Test System: A Focused Analytical Solution
The LISUN EDX-2A RoHS Test system exemplifies a dedicated EDX spectrometer engineered for high-throughput compliance screening and precise quantitative analysis. It integrates advanced hardware and software to meet the rigorous demands of modern EEE manufacturing and testing facilities.
Core Specifications and Testing Principles:
The system is built around a high-performance silicon drift detector (SDX) offering excellent energy resolution, typically better than 125 eV at the Mn Kα line, which is critical for separating closely spaced spectral peaks such as those of lead (Lα at 10.55 keV) and arsenic (Kα at 10.53 keV). It employs a low-power, air-cooled X-ray tube with a rhodium (Rh) target as the excitation source, eliminating the need for liquid nitrogen or external cooling water. This design choice enhances operational simplicity and reduces running costs. The instrument’s chamber accommodates samples of varying sizes and geometries, facilitated by a motorized sample stage and integrated visual positioning system.
Its testing principle leverages the fundamental physics described earlier: the X-ray tube irradiates the sample, exciting characteristic X-rays which are collected by the SDD. The proprietary software suite performs automatic spectrum acquisition, peak identification, and ZAF correction. It includes dedicated RoHS compliance modules that automatically compare quantified results against user-defined regulatory limits, generating clear pass/fail reports.
Industry Use Cases and Application Workflow:
The EDX-2A is deployed across the aforementioned industries for specific, critical tasks:
- Incoming Material Inspection: Verifying that batches of brass alloys for Electrical Components (switches, sockets) are lead-free, or that plastic resins for Household Appliance housings do not contain brominated flame retardants.
- Process Control: Monitoring the composition of solder pastes used in Office Equipment assembly lines to ensure they remain within specified tolerances.
- Finished Product Audit: Randomly sampling completed Cable and Wiring Systems to check for cadmium in PVC stabilizers or chromium in metal coatings.
- Failure Investigation: Analyzing discolored or corroded areas on a printed circuit board from an Industrial Control System to identify the presence of chlorine (from flux residues) or sulfur (from environmental contamination).
A typical workflow involves sample preparation (often minimal, requiring only a flat, clean surface), selection of the appropriate test voltage and current, positioning under the collimator, and initiating the automated analysis. For homogeneous materials, a single test suffices. For complex assemblies, testing may be required on individual, mechanically separable components.
Competitive Advantages in the Analytical Landscape:
The EDX-2A’s value proposition is defined by several key attributes:
- Regulatory-Centric Design: The hardware and software are optimized explicitly for the sensitivity ranges and elements mandated by RoHS, REACH, and similar standards, providing targeted performance where it is most needed.
- Operational Efficiency: The air-cooled X-ray tube and SDD detector enable rapid start-up and high count-rate acquisition, significantly increasing sample throughput compared to older Si(Li) detector systems.
- User-Optimized Software: The interface guides operators through calibration, testing, and reporting with built-in regulatory limits and templates, reducing training overhead and minimizing human error in report generation.
- Robust Quantification: Advanced matrix correction algorithms ensure reliable quantitative results for diverse material types, from light-element polymers to heavy-metal alloys, which is essential for making definitive compliance judgments.
The following table summarizes its typical analytical performance for key regulated elements:
| Element (Regulated Form) | Characteristic Line | Typical Minimum Detection Limit (MDL) | Key Application Example |
|---|---|---|---|
| Lead (Pb) | Lα | ~5-10 ppm | Solder, brass alloys, PVC stabilizers |
| Cadmium (Cd) | Lα | ~2-5 ppm | Plastics, coatings, battery contacts |
| Mercury (Hg) | Lα | ~10-15 ppm | Switches, fluorescent lamp components |
| Chromium (Total) | Kα | ~15-20 ppm | Metal platings, anti-corrosion coatings |
| Bromine (Br) | Kα | ~10-15 ppm | Flame-retardant plastics in enclosures |
Methodological Considerations and Limitations
A comprehensive understanding of EDX requires acknowledgment of its inherent limitations. The technique is generally considered a bulk analysis method for the micro-volume sampled, with a penetration and interaction depth ranging from 1 to several micrometers, depending on the accelerating voltage and material density. It provides little to no direct chemical state information; for instance, it cannot distinguish between trivalent and hexavalent chromium—a determination that requires complementary techniques like Wet Chemistry or UV-Vis spectroscopy.
Sample preparation, while often minimal, is crucial. Surface roughness can degrade quantitative accuracy due to variable X-ray absorption and topography effects. The analysis of insulating materials may require coating with a thin conductive layer (e.g., carbon), though modern systems often offer low-vacuum or environmental modes to mitigate charging. Furthermore, spectral overlaps (e.g., between sulfur Kα and lead Mα lines) must be carefully deconvoluted by the software to avoid false positives or negatives, underscoring the importance of high spectral resolution and sophisticated peak-fitting routines.
Future Trajectories and Concluding Remarks
The evolution of EDX spectroscopy continues, driven by advancements in detector technology, software intelligence, and system integration. Trends include the development of detectors with even higher count-rate capabilities and improved light-element (boron, carbon, nitrogen, oxygen) sensitivity, expanding the technique’s utility in polymer and ceramic analysis. Increased automation, including robotic sample handling and artificial intelligence for automated spectral interpretation and anomaly detection, is enhancing throughput and consistency in high-volume industrial settings.
In conclusion, Energy-Dispersive X-ray Spectroscopy remains an analytically robust, versatile, and essential technique for elemental characterization. Its principle, rooted in fundamental atomic physics, enables a wide spectrum of applications from advanced materials research to imperative compliance screening. Dedicated systems, such as the LISUN EDX-2A RoHS Test, distill this powerful technology into focused, reliable, and efficient tools that directly support manufacturing quality, regulatory adherence, and product safety across the global electronics and allied industries. As material regulations evolve and supply chains become more complex, the role of precise, accessible elemental analysis will only grow in significance.
FAQ Section
Q1: Can the EDX-2A definitively confirm RoHS compliance for chromium, specifically that it is not in the hexavalent state?
A1: No. Standard EDX spectroscopy, including the EDX-2A, measures total chromium content. It cannot spectate between different oxidation states, such as trivalent chromium [Cr(III)] and restricted hexavalent chromium [Cr(VI)]. A positive detection of chromium above a threshold necessitates a follow-up test using a chemical method, such as colorimetric diphenylcarbazide testing per IEC 62321-7-1, to determine if the hazardous Cr(VI) species is present.
Q2: What is the typical sample size requirement, and how is analysis performed on very large or irregularly shaped objects?
A2: The instrument’s sample chamber defines the maximum physical dimensions for direct placement. For samples that are too large, a common practice is to take a representative scrape, cutting, or swab from the product. This extracted material is then prepared as a homogeneous pellet or placed in a specialized sample cup for analysis. The fundamental requirement is to present a flat, representative surface to the X-ray beam for reliable quantification.
Q3: How does the system handle the analysis of thin coatings or plating, where the substrate material may interfere?
A3: For layered structures, the analysis becomes more complex. The EDX-2A software includes optional film analysis models. By adjusting the excitation voltage, the analyst can attempt to optimize the generation of X-rays from the coating while minimizing contribution from the substrate. However, for very thin coatings (sub-micron), the signal may be dominated by the substrate. In such cases, cross-sectional analysis of a mounted and polished sample, or the use of a complementary technique like Glow Discharge Optical Emission Spectrometry (GD-OES), may be more appropriate for accurate coating thickness and composition measurement.
Q4: What quality assurance procedures are necessary to maintain the accuracy and regulatory standing of EDX compliance testing?
A4: A rigorous QA protocol is essential. This includes daily or weekly verification of system performance using certified calibration standards to check for energy scale drift and sensitivity. Regular recalibration with a set of multi-element standards is required to maintain quantitative accuracy. Furthermore, laboratories should adhere to internal quality control procedures, such as analyzing control samples with known values and participating in inter-laboratory comparison programs, to ensure ongoing compliance with standards such as ISO/IEC 17025.