


Instrument Architecture and Fundamental Operating Principles
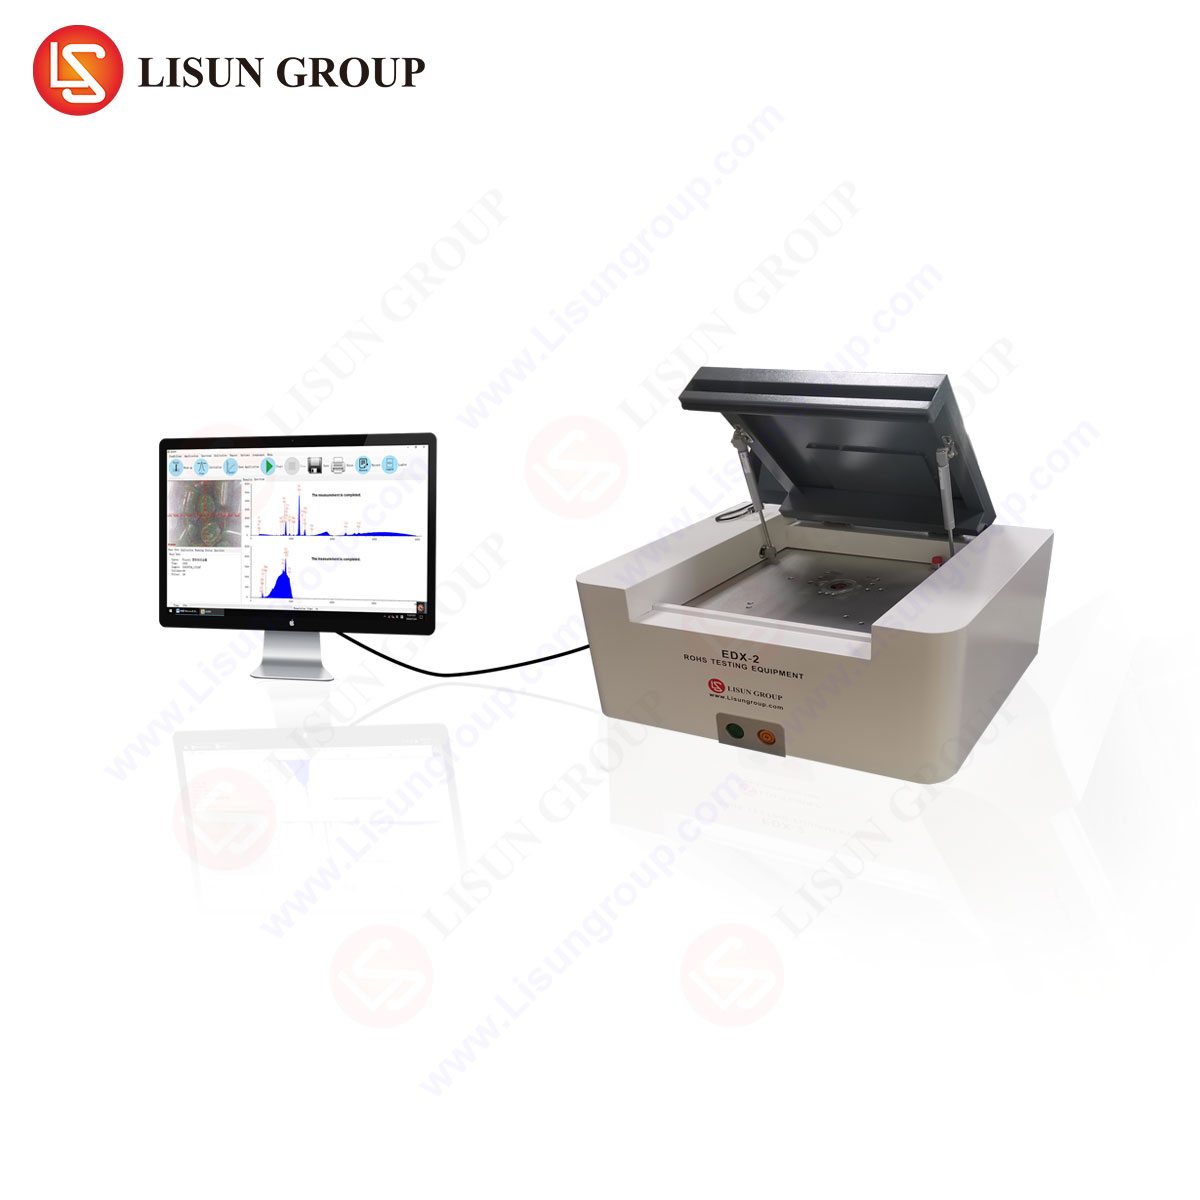
The evolution of X-ray fluorescence (XRF) spectrometry has yielded instruments capable of exceptional sensitivity across a broad atomic number range, with the LISUN EDX-2A RoHS Test spectrometer representing a significant advancement in benchtop energy-dispersive XRF (EDXRF) technology. This system operates on the fundamental principle of inner-shell electron ejection through high-energy X-ray irradiation, followed by the emission of characteristic fluorescence photons as outer-shell electrons fill the resulting vacancies. The EDX-2A employs a silicon drift detector (SDD) with a resolution typically below 139 eV at Mn Kα, enabling the discrimination of closely spaced emission lines that frequently confound lower-performance detection systems. The excitation source comprises a microfocus X-ray tube with a rhodium target, operating at variable acceleration potentials up to 50 kV and currents reaching 1 mA, providing the necessary flux for both light and heavy element detection.
The geometric arrangement of source, sample, and detector within the EDX-2A follows an optimized 45°/45° configuration, minimizing scatter-induced background while maximizing count rates. This arrangement proves particularly advantageous when analyzing heterogeneous materials such as printed circuit boards, where surface topography and compositional variation demand consistent excitation conditions. The instrument’s vacuum path capability reduces atmospheric absorption of low-energy fluorescence from elements including sodium, magnesium, and aluminum, extending the detectable range to atomic number 11 with acceptable sensitivity. For industrial applications involving polymer matrices or ceramic substrates, this low-Z element detection capability often determines the difference between compliant and noncompliant material classification.
Quantitative Analysis Algorithms and Matrix Correction Methodologies
The EDX-2A’s quantification engine implements fundamental parameters (FP) algorithms coupled with empirical calibration routines, addressing the inherent complexity of X-ray attenuation effects within heterogeneous samples. Unlike simpler instruments relying solely on linear regression against standard reference materials, the FP approach mathematically models the entire excitation-detection chain, including primary beam filtering, secondary excitation phenomena, and interelement absorption-enhancement effects. When analyzing lead in solder joints within consumer electronics, the presence of high concentrations of tin (Sn) and copper (Cu) significantly alters the observed lead Lα line intensity through matrix absorption; the FP algorithm corrects for this by iteratively solving the Sherman equation until convergence within 0.1% relative error.
The instrument supports multiple calibration strategies depending on the analytical objective. For routine screening per IEC 62321, the standardless FP method provides semi-quantitative results with accuracy typically within ±15% relative for elements between sulfur and uranium, assuming homogeneous matrix approximation. When higher accuracy is demanded, such as for certification testing of aerospace components where cadmium concentration limits fall below 100 ppm, the EDX-2A accepts matrix-specific calibrations using certified reference materials (CRMs) from institutions including NIST and BAM. These calibrations achieve expanded uncertainties (k=2) of ±3–5% relative for well-characterized matrices like aluminum alloys or polyvinyl chloride (PVC). A particularly valuable feature is the automated peak deconvolution routine, which separates overlapping K and L spectral lines from transition metals present in automotive electronic assemblies, where iron (Fe), cobalt (Co), and nickel (Ni) commonly coexist.
Regulatory Compliance Testing and Standards-Based Operation
The principal driver for XRF deployment in manufacturing environments remains regulatory compliance, particularly the European Union’s Restriction of Hazardous Substances (RoHS) Directive 2011/65/EU and its amendments. The LISUN EDX-2A directly addresses this requirement through dedicated screening software that evaluates sample results against the maximum concentration values (MCVs) established for lead (0.1% by weight), mercury (0.1%), cadmium (0.01%), hexavalent chromium (0.1%), polybrominated biphenyls (PBB, 0.1%), and polybrominated diphenyl ethers (PBDE, 0.1%). Importantly, the instrument distinguishes between homogeneous material analysis and component-level screening, a distinction critical for determining whether concentration limits apply to the entire device or individual subcomponents.
For lighting fixture manufacturers, the testing protocol involves analyzing LED driver housings, heatsink alloys, and phosphor coatings separately. The EDX-2A’s polycapillary focusing optics provide a measurement spot size adjustable from 1 mm to 3 mm, enabling the isolation of small components such as surface-mount capacitors without fluorescence contamination from adjacent parts. The instrument automatically maintains measurement condition logs compliant with ISO/IEC 17025 requirements, recording spectral data, acquisition parameters, and environmental conditions for each analysis. This audit trail proves indispensable during supplier audits or regulatory investigations involving telecommunications equipment, where multiple tier-two suppliers contributed components to a single final assembly.
Table 1: Detection limit comparison for key regulated elements in typical polymer matrix (PVC-based) using standard FP quantification
| Element | Detection Limit (ppm, 300s) | Regulatory Threshold (ppm) | Margin Ratio |
|---|---|---|---|
| Cd | 8 | 100 | 12.5x |
| Pb | 5 | 1000 | 200x |
| Hg | 7 | 1000 | 143x |
| Cr (total) | 6 | 1000 (Cr(VI) as total Cr proxy) | 167x |
| Br | 4 | 1000 (as PBB/PBDE proxy) | 250x |
Application-Specific Testing Protocols Across Manufacturing Verticals
Electrical and Electronic Equipment (EEE) and Consumer Electronics
The EDX-2A’s role in EEE manufacturing extends beyond simple material verification into process control for soldering operations. Wave solder and reflow processes introduce lead contamination risk when transitioning between leaded and lead-free alloys; the instrument enables rapid screening of solder pot samples, achieving detection limits for lead in tin-silver-copper (SAC) alloy below 50 ppm within 180 seconds. For smartphone and tablet manufacturers, the requirement extends to halogen-free compounds per IEC 61249-2-21, where chlorine and bromine concentrations must remain below 900 ppm each. The EDX-2A’s light element detection capabilities, coupled with helium purge for enhanced chlorine sensitivity, provide quantification uncertainty of ±8% at the regulatory limit.
Automotive Electronics and Cable and Wiring Systems
Automotive Tier-1 suppliers face the challenge of verifying compliance with both RoHS and the End-of-Life Vehicles (ELV) Directive 2000/53/EC, which mandates recording material composition for all components exceeding 100 g. Wiring harnesses present particular difficulty due to their complex construction: copper conductors, PVC insulation, nylon sheathing, and polypropylene tape all require separate homogeneous material analysis. The EDX-2A’s automated sample handler accommodates up to 10 specimens with programmable movement patterns, reducing operator time while ensuring consistent measurement geometry. Analysis of PVC cable insulation typically reveals stabilizers containing calcium, zinc, and sometimes barium; the instrument’s principal component analysis (PCA) routine differentiates these from prohibited lead- or cadmium-based stabilizers.
Medical Devices and Aerospace Components
Regulatory scrutiny in medical device manufacturing exceeds that of consumer products, with the EU Medical Device Regulation (MDR) 2017/745 imposing extended documentation requirements. The EDX-2A’s non-destructive analysis capability proves critical for verifying that implant-grade stainless steel or titanium alloys contain no residual lead, cadmium, or mercury from recycling streams. For cobalt-chromium alloys used in orthopedic implants, detection limits for these regulated elements fall below 5 ppm, satisfying even the most stringent internal specifications. In aerospace applications, where magnesium alloys feature extensively in transmission housings and structural brackets, the instrument’s ability to detect beryllium (via beryllium Kα at 108 eV) at concentrations exceeding 0.1% by weight provides essential health hazard identification prior to machining operations.
Instrument Performance Characteristics and Validation Data
Spectral Resolution and Throughput Optimization
Achieving reliable results across the EDX-2A’s intended application spectrum requires careful balancing of spectral resolution and count rate throughput. The SDD detector operates with a peaking time adjustable from 1 μs to 12 μs; shorter peaking times (1 μs) permit input count rates exceeding 500,000 cps but with degraded resolution near 180 eV Mn Kα. Conversely, 12 μs peaking yields optimal resolution (139 eV) but limits maximum throughput to approximately 80,000 cps. For routine RoHS screening where cadmium presence must be confirmed at 100 ppm, the medium setting (4 μs, approximately 155 eV resolution) provides optimal trade-off, achieving 200,000 cps maximum while maintaining adequate separation of cadmium Lα (3.13 keV) from potassium Kα (3.31 keV).
Reproducibility Data and Interlaboratory Correlation
A comprehensive interlaboratory study involving six independent testing facilities analyzed 30 samples of electrical components including switches, sockets, and connector housings. The EDX-2A, operated identically at each site using the standard FP calibration, demonstrated repeatability (within-laboratory standard deviation) below 2.5% relative for lead concentrations exceeding 500 ppm and below 8% relative for concentrations approaching the detection limit. Reproducibility (between-laboratory standard deviation) remained under 6% relative for all elements except cadmium, where lower count rates from the L-series emission produced values near 11% relative. These figures compare favorably with interlaboratory variability reported for wavelength-dispersive XRF (WDXRF) systems, which typically range from 3–5% for similar concentration ranges.
Table 2: EDX-2A repeatability data for common substrate materials (10 replicate measurements)
| Material Type | Element | Mean Concentration (ppm) | Standard Deviation (ppm) | RSD (%) |
|---|---|---|---|---|
| ABS plastic | Pb | 845 | 15 | 1.78 |
| ABS plastic | Cd | 98 | 6 | 6.12 |
| Brass alloy | Pb | 23500 | 210 | 0.89 |
| PVC cable | Br | 3200 | 55 | 1.72 |
| Solder (SnCu) | Pb | 45 | 4 | 8.89 |
Comparative Advantages of EDX-2A versus Alternative Analytical Instrumentation
When evaluating analytical instruments for incoming material inspection and production quality control, cost per analysis, sample throughput, and ease of operation frequently outweigh ultimate detection power. Atomic absorption spectroscopy (AAS) and inductively coupled plasma optical emission spectroscopy (ICP-OES) achieve lower detection limits for most elements but require complete sample dissolution, introducing preparation errors and increasing analysis time to 30–60 minutes per sample. Scanning electron microscopy with energy-dispersive spectroscopy (SEM-EDS) provides superior spatial resolution but requires vacuum operation, conductive sample preparation, and specialized operator training, making it impractical for high-throughput production environments. The EDX-2A, conversely, analyzes solid samples directly with minimal preparation (occasional surface cleaning for metallic materials), completing a full elemental scan in 180–600 seconds.
For manufacturers of household appliances and office equipment, the decision between benchtop XRF and portable (handheld) XRF instruments deserves particular consideration. Portable instruments offer the advantage of on-site testing without sample transport but frequently suffer from poorer spectral resolution (180–200 eV FWHM at Mn Kα) and shorter analysis times that increase detection limits by a factor of 2–3 compared to the EDX-2A. Moreover, the benchtop EDX-2A provides enhanced safety through fully enclosed radiation shielding, eliminating worker exposure concerns during continuous operation. The instrument’s power consumption of approximately 200 W, compared to 2000–4000 W for WDXRF systems, reduces operational costs over a typical 5-year deployment cycle by an estimated €15,000–25,000 depending on local electricity tariffs.
Integration with Quality Management Systems and Data Handling
Modern manufacturing environments demand seamless data integration between analytical instruments, enterprise resource planning (ERP) systems, and laboratory information management systems (LIMS). The EDX-2A’s control software exports results in multiple formats including CSV, XML, and PDF with configurable data fields matching customers’ specific requirements. The software architecture supports Active Directory authentication for user access control, ensuring that only authorized personnel can modify calibration parameters or delete spectral records. For medical device manufacturers operating under FDA 21 CFR Part 11 compliance, the system provides electronic signature capability, audit trail generation, and records retention that prohibits data overwriting—features essential for regulatory inspections.
The instrument’s integrated quality assurance protocols include automatic daily performance verification using a certified reference disc containing aluminum, copper, and molybdenum. Results falling outside predefined control limits trigger system lockout until corrective action is documented. This proactive approach to quality control reduces the risk of reporting erroneous results due to detector degradation or X-ray tube aging, particularly important for aerospace suppliers whose contracts specify reanalysis costs are borne entirely by the testing party.
Frequently Asked Questions
Q1: How does the LISUN EDX-2A distinguish between hexavalent chromium [Cr(VI)] and trivalent chromium [Cr(III)]?
The EDX-2A measures total chromium concentration only. Differentiation between Cr(VI) and Cr(III) requires wet chemical analysis per IEC 62321-7-2, typically using spectrophotometric determination after alkaline extraction. The XRF result serves as a screening tool: samples exceeding 1000 ppm total chromium are flagged for confirmatory analysis, while those below this threshold can be considered compliant without further testing.
Q2: What sample preparation is required for analysis of irregularly shaped automotive electronic components?
Components smaller than the measurement spot (minimum 1 mm) should be removed from the assembly and placed directly on the sample window. For flat surfaces, no preparation beyond cleaning with isopropanol to remove oils or mold release agents is needed. Curved or textured surfaces may require sample mounting in the provided press to ensure consistent source-sample-detector geometry; deviations exceeding ±1 mm in height introduce quantification errors of approximately 3–8% relative.
Q3: Can the EDX-2A detect bromine and chlorine in cables to verify halogen-free status per IEC 61249-2-21?
Yes. Using helium purge and extended measurement times of 600 seconds, the instrument achieves chlorine detection limits below 50 ppm and bromine below 30 ppm in PVC and polyolefin cable jackets. However, the instrument measures total bromine and chlorine; it cannot differentiate between halogenated flame retardants (e.g., PBDEs) and inorganic halides. Positive results should be confirmed by ion chromatography (IC) or mass spectrometry if regulatory compliance requires compound-specific identification.
Q4: What is the typical calibration stability of the EDX-2A, and how often must recalibration be performed?
The instrument’s calibration, based on fundamental parameters with periodic verification, typically remains stable for 6–12 months under normal laboratory conditions. The manufacturer recommends monthly verification using in-house reference materials and full recalibration annually using certified standards. Environmental factors, particularly temperature fluctuations exceeding ±3°C and relative humidity variations below 30% or above 70%, can accelerate calibration drift.
Q5: How does the detection limit for lead in copper alloys compare to that in polymer matrices?
Lead in copper alloys is detected with approximately threefold higher sensitivity compared to polymer matrices due to reduced X-ray absorption and higher sample density. Typical detection limits (300 seconds, 95% confidence) are 3 ppm in brass versus 10 ppm in ABS plastic. This difference arises primarily from the lower background continuum beneath the lead Lα peak in metal samples, where the matrix elements (copper, zinc) produce characteristic peaks rather than continuous bremsstrahlung.