


Advanced Material Characterization via Wavelength Dispersive Spectroscopy for Regulatory Compliance and Failure Analysis
Fundamental Principles of Wavelength Dispersive Spectrometry
Wavelength Dispersive Spectroscopy (WDS), operating within the broader framework of Electron Probe Microanalysis (EPMA) and certain advanced X-ray Fluorescence (XRF) systems, represents a cornerstone technique for quantitative elemental analysis. Its operational principle is distinct from the more common Energy Dispersive Spectroscopy (EDS). While EDS separates characteristic X-rays by their energy, WDS employs diffraction crystals to separate them by wavelength. When a sample is excited by a high-energy electron beam or X-ray source, inner-shell electrons are ejected from constituent atoms. The subsequent relaxation process, where outer-shell electrons fill these vacancies, results in the emission of X-ray photons with energies—and thus wavelengths—unique to each element.
The critical component in a WDS system is the analyzing crystal. According to Bragg’s Law (nλ = 2d sin θ), X-rays of a specific wavelength (λ) will be diffracted constructively at a given angle (θ) by a crystal with a known lattice spacing (d). By mechanically rotating the crystal and detector through a range of θ angles, the spectrometer scans through a spectrum of wavelengths. This physical dispersion provides unparalleled spectral resolution, typically an order of magnitude finer than that achievable with EDS. This high resolution is instrumental in separating closely spaced X-ray lines, such as the sulfur Kα (2.307 keV) and lead Mα (2.346 keV) lines, which are often indistinguishable in EDS spectra, leading to critical analytical errors in restricted substance screening.
Analytical Advantages in Complex Matrices and Trace Detection
The superior spectral resolution of WDS confers several decisive analytical advantages, particularly in the context of modern manufacturing and compliance. First is the dramatic reduction in background noise. The narrow wavelength windows accepted by the crystal and associated collimators result in significantly higher peak-to-background ratios. This directly translates to lower limits of detection (LOD), often in the range of 10-100 ppm for mid-Z elements, which is essential for enforcing strict regulatory thresholds like the 1000 ppm limit for cadmium or lead under the EU RoHS directive.
Second, WDS excels in analyzing samples with complex, overlapping spectral features. In electrical components, alloys containing multiple transition metals (e.g., brass with Cu, Zn, and possibly Pb or Fe) or mineral-filled plastics (with Ca, Si, Ti, Ba) produce dense X-ray spectra. WDS can deconvolute these interferences with high fidelity, enabling accurate quantification of each constituent. This capability is paramount for failure analysis in automotive electronics or aerospace components, where a minor contaminant, such as chlorine from flux residue or bromine from a degraded flame retardant, must be precisely identified and quantified to determine root cause.
Integration of WDS Principles in Modern XRF Compliance Instrumentation
While traditional microprobe-based WDS is a laboratory technique, its core principles of high-resolution wavelength dispersion have been successfully engineered into advanced benchtop XRF systems designed for high-throughput compliance screening. These systems utilize fixed or semi-fixed diffraction crystals and detectors to target specific elemental spectral lines of regulatory concern, optimizing speed and accuracy for industrial quality control.
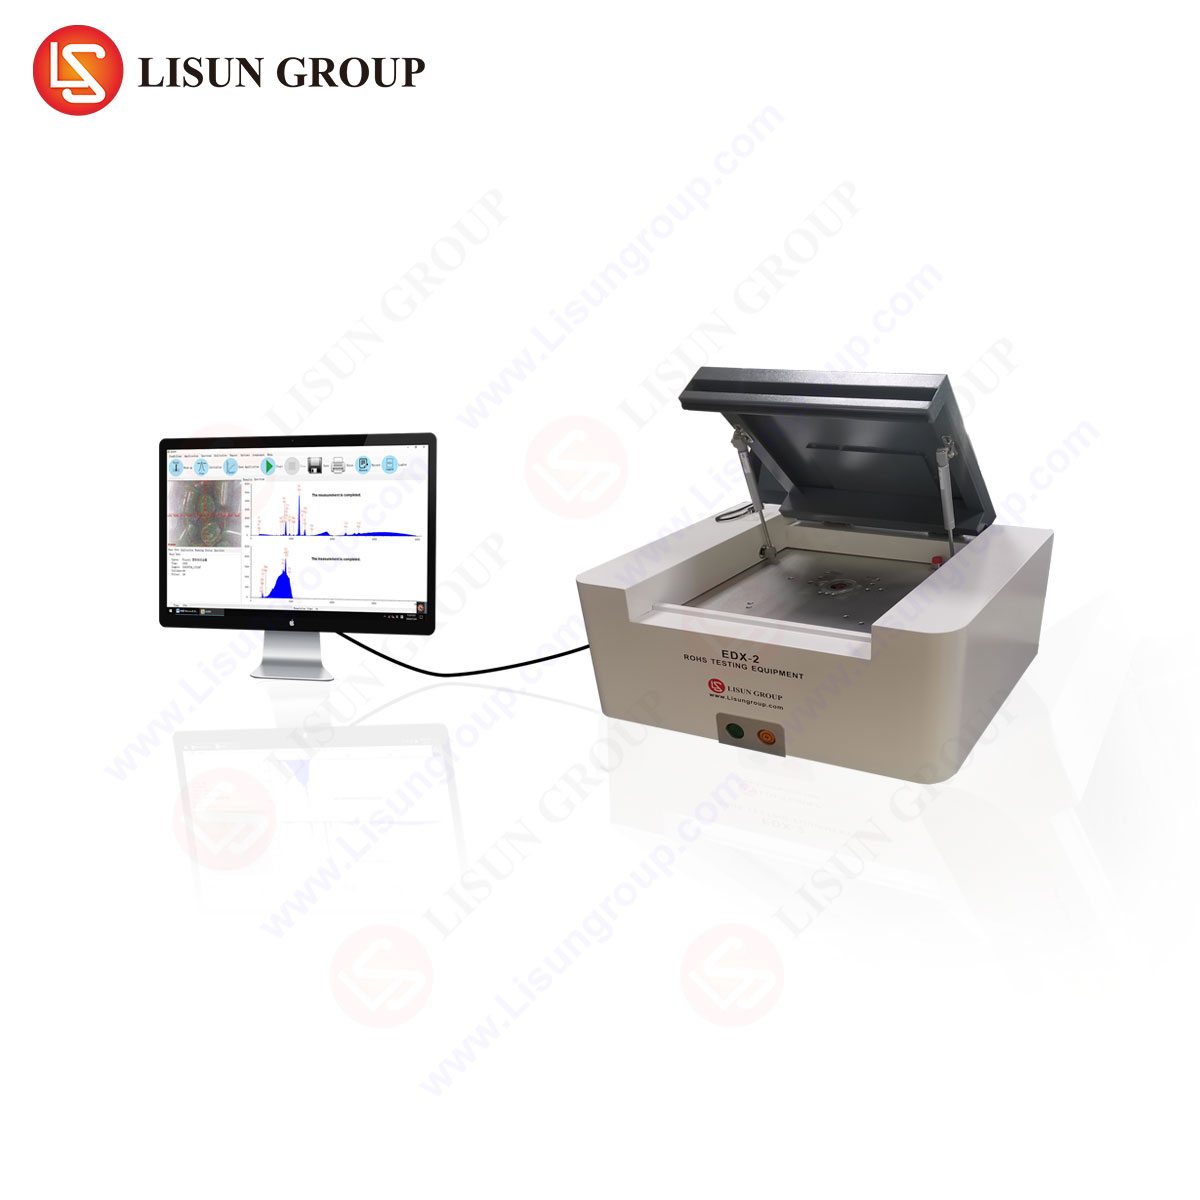
The LISUN EDX-2A RoHS Test system exemplifies this applied implementation. It incorporates a optimized optical path with high-performance diffraction crystals and a proportional counter detector to achieve the resolution necessary for reliable RoHS and halogen screening. Its excitation source, a high-performance X-ray tube, generates a stable photon flux to excite samples. The system’s fundamental parameters (FP) software algorithm, calibrated against certified reference materials, leverages the high-resolution spectral data to correct for matrix effects—such as absorption and enhancement between elements—ensuring quantitative accuracy across diverse material types, from lightweight polymers to dense metal alloys.
Industry-Specific Applications and Use Case Scenarios
The requirement for precise elemental analysis spans virtually all sectors manufacturing electrical and electronic equipment. WDS-level precision, as embedded in instruments like the EDX-2A, addresses unique challenges in each vertical.
In automotive electronics and aerospace components, reliability under extreme conditions is non-negotiable. Screening for restricted substances like hexavalent chromium (via Cr quantification) in corrosion-resistant coatings or mercury in switches is a baseline compliance activity. More critically, the technique is used for material verification of specialized alloys in connectors and for detecting trace contaminants (e.g., sulfur, chlorine) that could induce galvanic corrosion or conductive anode filament (CAF) growth in printed circuit board assemblies.
For telecommunications equipment and industrial control systems, the miniaturization of components and the use of novel, lead-free solder alloys (e.g., Sn-Ag-Cu with dopants) necessitate analysis with minimal spatial overlap from adjacent materials. The high spectral resolution allows for accurate measurement of silver and copper concentrations in solder joints, and the certain identification of regulated elements like cadmium in plating layers or beryllium in copper alloys, even when present at levels near detection limits.
The lighting fixtures and consumer electronics industries face challenges with heterogeneous materials. A single LED light bulb may contain a plastic housing, a metal heat sink, a phosphor-coated ceramic substrate, and solder connections. A high-resolution system can rapidly switch between calibration modes to accurately quantify lead in the solder, bromine in the housing plastic, and mercury within the phosphor, if present, ensuring comprehensive batch-level compliance.
Medical devices and electrical components such as switches and sockets demand the highest confidence in material declaration. False positives due to spectral overlaps are commercially and legally untenable. The ability to distinguish between molybdenum and sulfur, or between barium and titanium L-lines, prevents costly and unnecessary supply chain disruptions, while guaranteeing that devices are free from substances like phthalates (screened via chlorine quantification for PVC) or restricted heavy metals.
Technical Specifications and Operational Workflow of the EDX-2A System
The LISUN EDX-2A RoHS Test is engineered as a dedicated compliance screening tool. Its specifications are tailored to meet the rigorous demands of industrial QC laboratories.
- Excitation Source: A high-stability, air-cooled X-ray tube with a rhodium (Rh) target, capable of operating at voltages up to 50 kV. The Rh anode provides an optimal continuum spectrum for exciting a broad range of elements from magnesium (Mg) to uranium (U).
- Detection System: A combination of a high-resolution Si-PIN detector for rapid survey scans and a gas-proportional counter coupled with diffraction crystals for high-resolution WDS-like analysis of key regulated elements (e.g., Cd, Pb, Br, Cr, Hg).
- Measurement Capabilities: Quantitatively analyzes all RoHS-restricted elements (Cd, Pb, Hg, Cr, Br for PBB/PBDE, Cl for PVC). Detection limits are typically below 50 ppm for cadmium and lead in polymer matrices, meeting the 100 ppm threshold with a significant safety margin.
- Software & Calibration: The system employs an FP-based calibration engine, pre-loaded with optimized parameters for common material types (plastics, metals, ceramics). It features a streamlined workflow: sample positioning, selection of the appropriate test method (e.g., “PVC Plastic,” “Lead-Free Solder”), and automated analysis. Results are displayed in ppm or weight percent, with clear pass/fail indicators against user-defined limits.
- Sample Handling: Accommodates samples of varying sizes and geometries, up to a 400mm diameter and 200mm height chamber, with motorized XYZ staging for precise positioning and multi-point mapping for heterogeneous samples like cable and wiring systems.
Comparative Analysis with Alternative Methodologies
Understanding the position of WDS-based XRF requires comparison to other prevalent techniques. Energy Dispersive XRF (ED-XRF) is faster and often less costly but suffers from poorer resolution, leading to potential interferences and higher LODs, which can be inadequate for definitive compliance testing near threshold limits. Inductively Coupled Plasma Optical Emission Spectrometry (ICP-OES) offers excellent LODs but requires destructive, time-consuming acid digestion of samples, making it unsuitable for rapid screening of whole components or failure analysis on specific, tiny features.
The WDS-approach, as in the EDX-2A, occupies a critical middle ground. It provides non-destructive, spatially resolved analysis with LODs sufficient for enforcing RoHS and other regulations (e.g., China RoHS, ELV, WEEE) with high confidence. Its throughput is lower than simple ED-XRF guns but vastly higher than ICP for whole-component screening. Its key advantage is definitive accuracy; its high-resolution spectra minimize the need for repeated confirmatory testing via ICP, thereby reducing overall time-to-decision and cost of compliance.
Ensuring Data Integrity and Adherence to Standards
Data generated for compliance purposes must be traceable, accurate, and reproducible. Instruments like the EDX-2A support this through routine performance validation using certified reference materials (CRMs) traceable to national standards. The calibration is anchored to international test methods, including IEC 62321-3-1 (screening for lead, mercury, cadmium, chromium, and bromine using XRF). For quantitative analysis in complex matrices, the FP method is recognized as a robust mathematical correction technique, superior to simple empirical calibration for handling the wide variety of materials encountered in the electronics supply chain.
Standard operating procedures (SOPs) should include daily verification checks with a known calibration standard, periodic instrument qualification, and documentation of all analytical parameters. The system’s software typically includes audit trail features and data export functions compatible with laboratory information management systems (LIMS), ensuring full documentation for audits by customers or regulatory bodies.
Future Trajectories in Elemental Screening Technology
The evolution of elemental screening continues to be driven by stricter regulations, more complex materials, and the need for faster decision-making. Future iterations of WDS-based screening technology will likely focus on enhanced automation, including robotic sample loading and intelligent software that uses spectral fingerprints and machine learning algorithms to automatically identify material types and select optimal analysis parameters. The integration of complementary techniques, such as combining high-resolution XRF for elemental data with Fourier-Transform Infrared (FTIR) spectroscopy for polymer identification, in a single automated platform, represents a powerful direction for comprehensive material validation. Furthermore, as regulations evolve to include new substance groups (e.g., additional phthalates, bisphenols), the flexibility of wavelength-dispersive systems to be re-configured and re-calibrated for new spectral lines will ensure their continued relevance in the analytical laboratory.
Frequently Asked Questions (FAQ)
Q1: Can the EDX-2A reliably distinguish between different valence states of chromium, specifically to identify hexavalent chromium [Cr(VI)]?
A: No, standard XRF, including WDS-based systems like the EDX-2A, cannot determine chemical speciation or valence states. It measures the total elemental chromium content. A sample failing the total Cr threshold (e.g., >1000 ppm) must undergo a subsequent, validated chemical test, such as colorimetric testing per IEC 62321-7-1 or UV-Vis spectroscopy, to determine if the chromium present is in the restricted hexavalent form.
Q2: How does the system handle the analysis of very small or irregularly shaped components, such as a surface-mount device (SMD) capacitor?
A: The system’s motorized stage and collimated beam allow for precise positioning. The operator can define a small analysis spot size and place it directly on the component of interest. For very small parts, the system can perform a multi-point analysis to account for potential inhomogeneity. The large chamber accommodates fixtures and holders to secure irregular items.
Q3: What is the typical analysis time per sample, and does it vary by material type?
A: Analysis time is method-dependent. A simple screening test for a homogeneous polymer may take 60-120 seconds. A more comprehensive quantitative analysis on a complex, heterogeneous sample like a printed circuit board, requiring multiple measurement points and spectral processing for matrix corrections, may take 3-5 minutes. The software allows for pre-programmed methods to optimize time based on the required precision.
Q4: For cable insulation screening, how does the system ensure the signal comes only from the plastic and not the underlying copper conductor?
A: X-ray fluorescence is a near-surface technique, with penetration depth varying by element and matrix but typically in the micrometer to millimeter range. For most polymer insulation, the primary X-rays will not penetrate fully to the metal core. Furthermore, analytical methods for plastics are calibrated specifically for low-density matrices. If analysis of the insulation alone is critical, a small sample of the material can be cut and presented without the conductor.
Q5: How often does the instrument require calibration, and what is involved in maintenance?
A: The fundamental parameter (FP) calibration is stable and does not require frequent re-calibration. However, instrument performance must be verified regularly—typically at the start of each shift or day—using a certified reference material (CRM) or a internal check standard. Routine maintenance primarily involves keeping the sample chamber clean and ensuring the X-ray tube window is free of debris. The system is designed for minimal end-user maintenance, with more complex servicing performed by qualified engineers.